
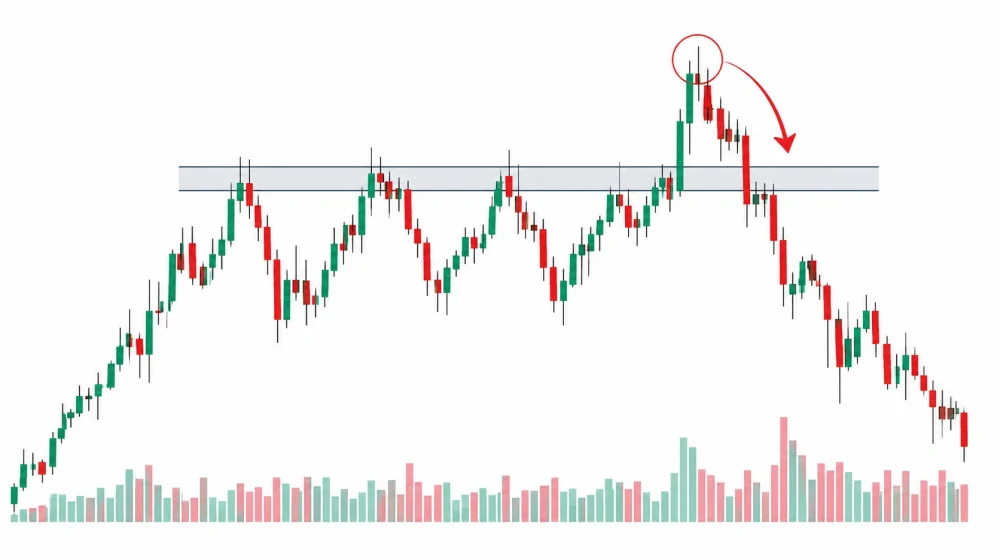
Apparent breakouts often attract traders at exactly the moment when a price move looks most convincing, only for the market to reverse shortly afterward. Normal volatility, temporary changes in liquidity, news reactions, and short-term order flow can push prices beyond familiar technical levels without producing a sustainable move. Understanding how genuine breakouts differ from short-lived market noise can help traders evaluate signals more critically before committing capital.
What a false breakout actually looks like in the market
A false breakout occurs when price moves beyond an important technical level but fails to remain there and quickly returns to its previous trading range. For example, an asset may rise above a resistance level, attract new buyers, and appear to begin a bullish trend. Instead of continuing higher, however, buying pressure disappears and the price falls back below resistance.
The same pattern can occur in the opposite direction. Price may temporarily break below support, encouraging traders to sell or enter short positions, before recovering rapidly. These situations are difficult because the initial movement can look almost identical to the beginning of a genuine breakout while it is happening.
Why false breakouts happen so frequently
False breakouts are a natural consequence of changing liquidity, competing market expectations, and ordinary short-term volatility around widely watched price levels.
- Temporary volatility. Normal price fluctuations can briefly push an asset beyond support or resistance without creating a lasting trend.
- News reactions. Headlines and economic announcements can produce an immediate move that reverses once traders evaluate the information more carefully.
- Low liquidity. When fewer orders are available, relatively small transactions may move prices farther than they would under normal conditions.
- Concentrated orders. Stop-loss and breakout orders often accumulate near obvious technical levels, potentially accelerating a temporary move once those prices are reached.
- Profit-taking. Traders already holding profitable positions may begin closing them as price reaches an important level, creating pressure in the opposite direction.
Because these forces interact continuously, traders should not assume that every movement beyond a chart level represents the beginning of a new trend.
What separates a genuine breakout from market noise
A stronger breakout usually shows evidence that the market is accepting prices beyond the previous boundary rather than merely touching or briefly crossing it. Traders therefore often examine what happens after the initial break instead of focusing exclusively on the moment when price crosses the level.
Continuation, sustained trading beyond the boundary, increased participation, and supportive price structure can make a breakout more convincing. A rapid move above resistance followed immediately by rejection may provide weaker evidence than a breakout that closes above the level and continues attracting buyers.
No combination of indicators can guarantee that a breakout will continue. Confirmation is primarily a way of reducing uncertainty, and stronger confirmation generally requires accepting that the eventual entry may occur later in the move.
Which confirmation signals traders commonly look for
Rather than relying on a single indicator, traders often combine several forms of confirmation to determine whether a breakout has meaningful support.
- A close beyond the level. Waiting for a candle to close outside support or resistance can filter some temporary intraperiod movements.
- Increased trading volume. Higher-than-normal volume may suggest broader participation behind the move.
- Continued momentum. Price continuing in the breakout direction can indicate that buying or selling pressure has not immediately disappeared.
- A successful retest. Price may return to the broken level and then continue, potentially showing that previous resistance has become support or vice versa.
- Confirmation on a higher timeframe. A breakout visible across longer chart periods may carry more significance than a brief movement on a very short-term chart.
The appropriate combination depends on the market and strategy. Adding more confirmation can reduce some false signals, but it can also produce later entries.
Why volume and momentum matter when evaluating a breakout
Volume and momentum can provide additional context about whether enough market participation exists to support a movement beyond an established level. A breakout accompanied by expanding volume may indicate that more traders are actively participating in the move rather than price drifting beyond the boundary during quiet trading.
Momentum helps evaluate the strength and persistence of price movement. If price crosses resistance but immediately loses momentum, the breakout may be more vulnerable to reversal. Strong directional movement followed by continued buying or selling pressure can make the move more convincing.
These measures still need context. Volume behaves differently across asset classes and trading venues, while unusually high activity can sometimes occur near the end of a move rather than its beginning. Neither volume nor momentum should therefore be interpreted as an automatic confirmation signal.
How timeframe selection can change whether a breakout looks real
A movement that appears dramatic on a short-term chart may represent little more than ordinary volatility when viewed from a longer timeframe. A five-minute candle can break above resistance and reverse quickly while the hourly or daily chart barely changes.
Higher timeframes generally filter more short-term noise and can help identify levels watched by a broader group of market participants. Shorter timeframes, meanwhile, provide earlier information and more trading opportunities but can generate considerably more false signals.
Some traders therefore use multiple timeframes: a longer chart to understand the broader trend and important levels, followed by a shorter chart to examine potential entries. The important point is to define the timeframe before entering rather than changing it afterward simply to justify a losing position.
How to evaluate a potential breakout before acting on the signal
A structured evaluation can help traders avoid reacting automatically to every movement beyond support or resistance. The objective is not to predict every successful breakout but to understand whether the potential reward justifies the uncertainty and risk.
- Identify the level. Determine why the support or resistance area matters and whether price has reacted to it previously.
- Examine the broader trend. Consider whether the potential breakout aligns with or moves against the prevailing market structure.
- Check participation. Review volume, momentum, volatility, and other relevant information for evidence that the move has meaningful support.
- Wait for appropriate confirmation. Depending on the strategy, this might involve a candle close, continuation beyond the level, or a successful retest.
- Define the risk before entering. Determine the invalidation level, potential loss, position size, and realistic profit opportunity before executing the trade.
This process cannot eliminate losing trades, but it can reduce impulsive decisions made simply because price has crossed a visible line on a chart.
Common mistakes traders make when reacting to breakouts
One of the most common mistakes is entering immediately after a dramatic price movement because the trader fears missing the opportunity. By that point, price may already be extended far beyond the original breakout level, creating an unfavorable entry and leaving little room before a normal pullback.
Another mistake is treating every support or resistance line as equally important. Technical levels are usually better viewed as areas rather than exact prices, and small movements beyond them can occur without changing the broader market structure.
Traders may also ignore volatility, volume, market conditions, or scheduled news and focus exclusively on the breakout itself. Others enter without deciding where the trade becomes invalid, making it difficult to manage risk when price reverses.
Ultimately, there is no perfect method for separating every real breakout from every false one in advance. Markets remain uncertain, and even strongly confirmed moves can fail. A more practical objective is to combine price structure, volume, momentum, timeframe context, confirmation, and predefined risk management so that individual false breakouts do not determine long-term trading results.