
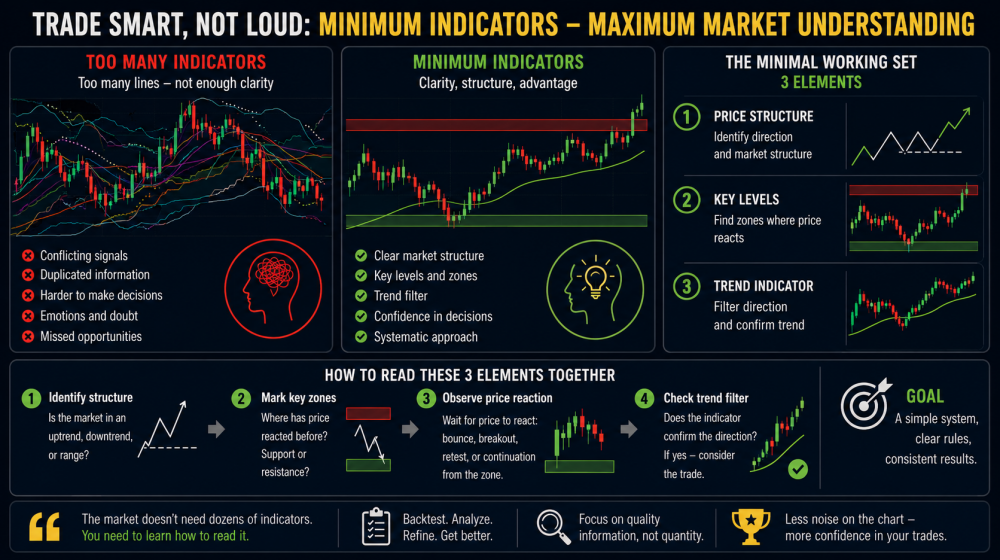
Traders often overload their charts with indicators, hoping to get more confirmations and reduce uncertainty. In practice, several tools often show the same information with a slight lag, and conflicting signals only make the decision harder. That’s why it’s more useful to first learn to read the market itself, and use indicators only as an auxiliary filter.
Why an Overabundance of Indicators Hurts Analysis
The more similar indicators are on a chart, the higher the risk of getting an illusion of additional confirmation instead of genuinely new information.
Many popular tools are calculated based on the same source data — primarily price, and sometimes volume. For example, a trader might simultaneously use several moving averages, MACD, and another trend indicator. The formulas differ, but a significant portion of the signals arise following the same price movement.
As a result, three matching readings don’t necessarily mean three independent arguments in favor of a trade. Sometimes it’s just one market fact presented in three different ways.
There’s another problem: different indicators can react to market changes at different speeds. One already shows a trend continuation, another warns of overbought conditions, a third hasn’t yet confirmed the move. The more such tools there are, the easier it is to find an argument both for and against entering.
This leads to analysis paralysis: instead of assessing context, the trader waits for a perfect alignment of all conditions or constantly changes their decision following the next reading. A working chart should therefore contain only those tools each of which has a clear, distinct function.
What a Market Signal Is and How It Differs from an Indicator
A market signal is an observable condition that helps make a trading decision, whereas an indicator is merely one way of processing market data.
A signal isn’t only a crossover of indicator lines. It can be any predefined event that matters within the trading system: price reaction to a level, a change in the movement’s structure, a rise in volume, or confirmation of trend direction.
That’s why it’s useful to separate the source of information from its interpretation. An indicator calculates a certain value, but that value by itself isn’t yet grounds for a trade. The value only takes on meaning in context.
The main sources of market signals include:
- price — direction of movement, ranges, impulses, and reactions at specific zones;
- market structure — the sequence of highs and lows, breakouts, and returns into a range;
- levels — areas where the balance between buyers and sellers previously shifted noticeably;
- volume — additional information about participant activity during a move;
- indicators — mathematically processed data used to filter or confirm a scenario.
This approach changes the logic of analysis. Instead of asking “what is the indicator showing right now?”, the trader asks “what is happening in the market, and does the tool confirm my interpretation?”
A Minimal Working Set of Three Elements
For basic analysis, three elements that answer different questions are often enough: price structure, key levels, and one trend indicator.
The first element is price structure. It helps determine the market’s current state. A sequence of rising highs and lows may indicate an upward structure, while falling ones may indicate a downward structure. If price moves between relatively stable boundaries with no pronounced direction, the market can be considered range-bound.
The second element is key levels or zones. They show where the trading scenario takes on practical meaning. These can be prior extremes, range boundaries, or areas where price previously showed a noticeable reaction.
The third element is one trend indicator. Its job isn’t to predict a reversal down to the exact candle, but to help filter direction and assess the state of the current move. A moving average or another trend tool the trader understands well can serve this role.
The key is the principle of separating functions. Structure answers “what is price doing?”, levels answer “where does it make sense to make a decision?”, and the indicator answers “does the chosen direction align with the trend filter?”
How to Read These Three Elements Together
The elements should be analyzed sequentially: first determine the market context, then find a significant area, and only after that use the indicator as an additional filter.
This order reduces the likelihood of a decision being built around a single random signal.
- Determine the structure. First assess whether the market is moving up, moving down, or trading in a range. At this stage, the indicator shouldn’t replace price analysis.
- Mark significant zones. Find levels, prior highs and lows, or range boundaries where the market’s reaction will matter for the chosen scenario.
- Wait for price behavior. Simply approaching a level isn’t yet a signal. What matters is seeing the reaction: holding the zone, breaking through, returning past the level, or continuing the move — depending on the strategy’s rules.
- Check the trend filter. Only after assessing price and context, check whether the chosen indicator confirms the trade direction. If not, the scenario can be skipped or you can wait for clearer conditions.
For example, if the structure remains upward, price returns to a previously significant zone, and the trend filter maintains a positive direction, the three elements describe a coherent scenario. This doesn’t guarantee a profitable trade, but it makes the basis for the decision transparent and testable.
How to Choose One Trend Indicator for Your Set
The best trend indicator isn’t the most complex one — it’s the one whose function is clear and which doesn’t duplicate elements already used in the analysis.
The tool should be chosen based on the specific task. If you need to visually determine the overall direction and price’s position relative to average dynamics, a moving average works well. If you need to assess changes in trend momentum, a trader might consider MACD. For other systems, ADX, Supertrend, or similar tools may be convenient.
The main thing is to formulate the rule for using it in advance. For example: the indicator is only needed to determine direction, not to find the precise entry point. Then its readings are easier to interpret and test.
It’s also important to account for the timeframe and the nature of the market. A setting that works well on a daily chart won’t necessarily be as useful intraday. So parameters are best evaluated on historical data and a sufficient sample of trades, rather than changed after a few unsuccessful signals.
Adding a second trend indicator only makes sense when it provides fundamentally new information. If both tools confirm an already-occurred price move at nearly the same time, an extra line on the chart is unlikely to improve the analysis.
When to Reconsider Your Signal Set
A signal set should be changed not after a single losing trade, but when accumulated results show that a particular element isn’t helping make better and more consistent decisions.
The first warning sign is when a trader can’t explain the function of each tool on the chart. If two indicators answer the same question and almost always confirm each other, one of them can probably be removed.
The second sign is constant contradictions. If the system regularly creates situations where one tool allows entry, a second forbids it, and a third says to wait, the rules need to be formalized. Each signal should have a clear priority.
The third reason for reconsideration is a change in the strategy itself. For example, switching from position trading to intraday trading may require different tool sensitivity and different logic for working with levels. It’s best not to change everything at once, though — otherwise it becomes impossible to tell which specific change affected the results.
It’s useful to keep a trading journal and record not just profit or loss, but also the reasons for entry, the state of the structure, position relative to levels, and the filter’s reading. After a sufficient series of observations, it becomes easier to see which signals are genuinely useful and which only create additional informational noise.
A minimalist approach doesn’t mean abandoning technical analysis. Its goal is to leave on the chart only the information that affects the decision and can be described by a specific rule. The clearer the role of each element, the easier it is to follow the trading system, check its statistics, and avoid decisions based on a random coincidence of indicators.